UNEP Food Waste Index Report 2024 - Launch Event
To mark the second annual International Day of Zero Waste, UNEP will launch its Food Waste Index Report 2024 on 27 March 2024. The report provides the latest global estimates on food waste, occurring at retail and consumer level.
(Read More...)
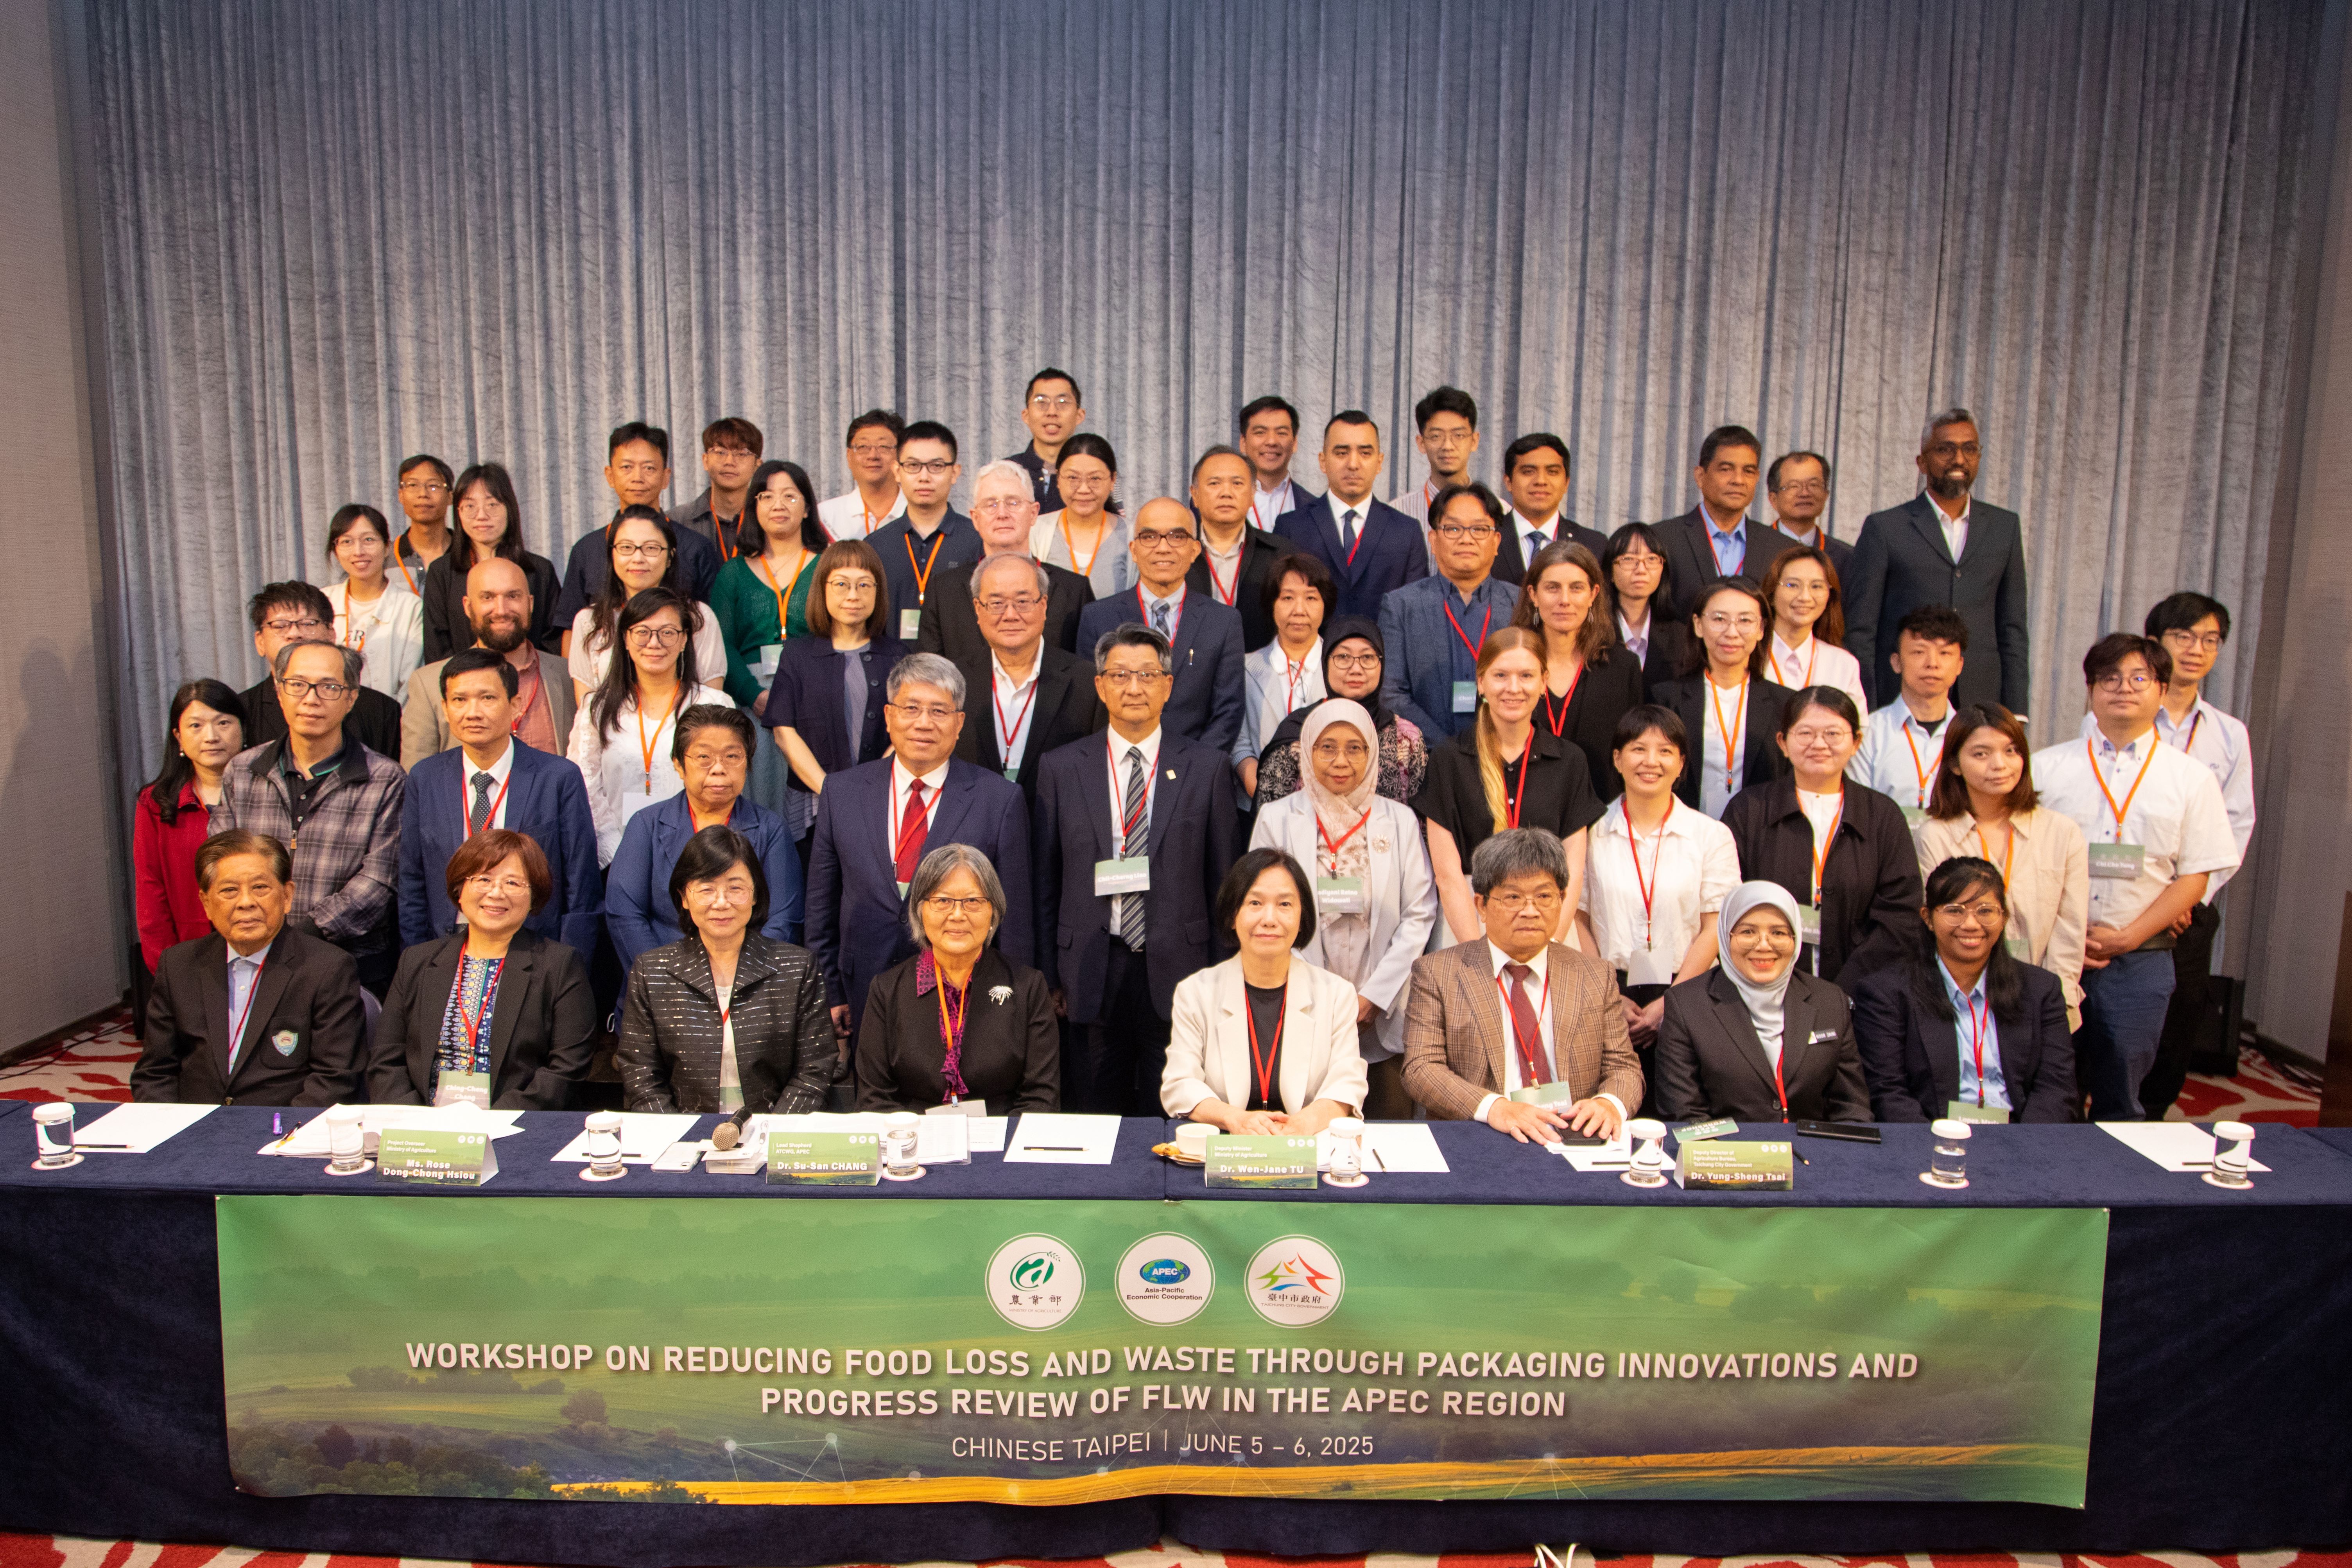
APEC Workshop on Reducing Food Loss and Waste by Strengthening Resilience and Digitalization in APEC Food System
(Read More...)
APEC-FLOWS GOAL

Reducing food losses and waste (FLW) is an urgent issue around the world and in Asia-Pacific Region. Although the assessment of global losses along the food chain is fraught with considerable uncertainties, there is no doubt that FLW are substantial. The Food and Agriculture Organization of the United Nations (FAO) estimates that roughly one third of food produced for human consumption gets lost or wasted globally. This amounts to approximately 1.3 billion tons per year.


As specified in the APEC Food Security Roadmap towards 2020 (APEC China, 2014): “APEC economies will strive to reduce FLW by 10% compared with 2011-2012 levels by 2020 in the Asia-Pacific Economies, aim to advance beyond the Millennium Development Goals 2015: Hunger Goals”.

APEC Project on Food Losses and Waste System (APEC-FLOWS) is a platform to share
Information on FLW quantification method and database
Toolkits and best practices to reduce FLW
APEC-FLOWS receives core funding from Chinese Taipei and the APEC Multi-Year Project (M SCE 02 2013A) – Strengthening Public-Private Partnership to Reduce Food Losses in the Supply Chain.
Support capacity building needs of APEC member economies on FLW reduction toward APEC goal 10% FLW reduction by 2020
APEC MEMBER ECONOMIES MAP
01
Australia
  • Population (thousand people)
    GDP (billion current US$)
    GDP per capita (current US$)
    CO2 emissions (metric tons per capita)
  • Global Food Security Index
    Food Loss and Waste (1,000 tons/year)
    FLW per capita (kgs/person/year)
2012 22,733.47 1,546.15 68,012.15 17.07 82.10 7,579.94 333.43
2013 23,128.13 1,576.18 68,150.11 16.10 81.50 7,514.03 324.89
2014 23,475.69 1,467.48 62,510.79 15.39 81.10 7,409.26 315.61
2015 23,816.00 1,351.69 56,755.72 15.34 83.00 7,413.74 311.29
2016 24,190.91 1,208.85 49,971.13 15.54 83.80 7,537.62 311.59
2017 24,601.86 1,330.14 54,066.47 16.15 83.50 8,186.39 332.75
2018 24,982.69 1,433.90 57,395.92 15.86 83.70 7,715.63 308.84
2019 25,364.31 1,392.68 54,907.10 15.60 81.10 7,374.00 290.72
2020 25,670.05 1,431.73 51,722.07 14.77 73.80 7,402.03 288.35
02
Brunei Darussalam
  • Population (thousand people)
    GDP (billion current US$)
    GDP per capita (current US$)
    CO2 emissions (metric tons per capita)
  • Global Food Security Index
    Food Loss and Waste (1,000 tons/year)
    FLW per capita (kgs/person/year)
2012 398.989 19.05 47740.5149 24.22676314 35.34 88.59
2013 404.421 18.09 44740.08502 19.29518002 37.52 92.78
2014 409.769 17.10 41726.78397 22.09494374 3.27 7.97
2015 414.907 12.93 31164.56203 17.04874345 3.33 8.02
2016 419.8 11.40 27157.82341 18.25638399 5.52 13.15
2017 424.47 12.13 28,572.15 16.94 5.32 12.54
2018 428.962 13.56735118 31628.32879 17.36231043 2.65 6.18
2019 433.285 13.46942294 31086.75108 16.11193294 2.65 6.12
2020 441.72 12.01 22,179.34 21.71 2.79 6.32
03
Canada
  • Population (thousand people)
    GDP (billion current US$)
    GDP per capita (current US$)
    CO2 emissions (metric tons per capita)
  • Global Food Security Index
    Food Loss and Waste (1,000 tons/year)
    FLW per capita (kgs/person/year)
2012 34,714.22 1,828.69 52,678.39 14.91 82.80 11,650.76 335.62
2013 35,082.95 1,847.21 52,652.59 14.80 81.60 12,275.06 349.89
2014 35,437.44 1,803.53 50,893.45 15.26 82.00 11,307.07 319.07
2015 35,702.91 1,556.13 43,585.51 15.39 82.70 11,877.04 332.66
2016 36,109.49 1,528.24 42,322.48 15.09 83.20 12,300.66 340.65
2017 36,543.32 1,649.88 45,148.55 15.55 82.50 12,178.50 333.26
2018 37,057.77 1,716.26 46,313.17 15.64 83.20 12,205.37 329.36
2019 37,589.26 1,736.43 46,194.73 15.05 84.00 12,395.56 329.76
2020 37,888.71 1,645.42 43,349.68 15.05 77.60 12,525.38 330.58
04
Chile
  • Population (thousand people)
    GDP (billion current US$)
    GDP per capita (current US$)
    CO2 emissions (metric tons per capita)
  • Global Food Security Index
    Food Loss and Waste (1,000 tons/year)
    FLW per capita (kgs/person/year)
2012 17,400.35 267.12 15,351.55 4.65 71.0 5,472.48 314.50
2013 17,571.51 278.38 15,842.94 4.74 71.20 5,501.95 313.12
2014 17,758.96 260.54 14,671.00 4.45 72.90 5,304.97 298.72
2015 17,969.35 243.92 13,574.17 4.63 73.60 5,209.88 289.93
2016 18,209.07 250.44 13,753.59 4.71 75.00 5,190.29 285.04
2017 18,470.44 277.08 14,999.37 4.74 74.70 5,385.00 291.55
2018 18,729.16 298.26 15,924.79 4.63 75.10 5,583.76 298.13
2019 18,952.04 282.32 14,896.45 4.83 77.70 5,603.97 295.69
2020 19,300.32 252.73 13,165.39 4.40 74.10 5,611.28 290.74
05
China
  • Population (thousand people)
    GDP (billion current US$)
    GDP per capita (current US$)
    CO2 emissions (metric tons per capita)
  • Global Food Security Index
    Food Loss and Waste (1,000 tons/year)
    FLW per capita (kgs/person/year)
2012 1,350,695.00 8,532.23 6,316.92 7.42 62.5 437,067.64 323.59
2013 1,357,380.00 9,570.41 7,050.65 7.56 62.5 444,910.28 327.77
2014 1,364,270.00 10,475.68 7,678.60 7.54 64.20 475,711.02 348.69
2015 1,371,220.00 11,061.55 8,066.94 7.40 65.20 491,939.80 358.76
2016 1,378,665.00 11,233.28 8,147.94 7.18 66.40 496,369.18 360.04
2017 1,386,395.00 12,310.41 8,879.44 7.23 64.20 504,277.12 363.73
2018 1,392,730.00 13,894.82 9,976.68 7.53 65.10 488,927.51 351.06
2019 1,397,715.00 14,342.90 10,261.68 7.65 71.90 508,009.31 363.46
2020 1,424,929.78 14,687.74 10,408.72 7.76 70.30 509,207.96 357.36
06
Hong Kong, China
  • Population (thousand people)
    GDP (billion current US$)
    GDP per capita (current US$)
    CO2 emissions (metric tons per capita)
  • Global Food Security Index
    Food Loss and Waste (1,000 tons/year)
    FLW per capita (kgs/person/year)
2012 7,150.10 262.63 36,730.88 6.01 1,237.10 173.02
2013 7,178.90 275.70 38,403.78 6.21 1,217.89 169.65
2014 7,229.50 291.46 40,315.29 6.33 1,139.66 157.64
2015 7,291.30 309.38 42,431.89 5.85 1,156.21 158.57
2016 7,336.60 320.84 43,731.11 5.95 1,156.64 157.65
2017 7,391.70 341.24 46,165.86 1,170.50 158.35
2018 7,451.00 361.69 48,542.89 1,105.96 148.43
2019 7,507.40 366.03 48,755.84 1,122.76 149.55
2020 7,500.96 252.73 46,109.23 1,140.21 152.01
07
Indonesia
  • Population (thousand people)
    GDP (billion current US$)
    GDP per capita (current US$)
    CO2 emissions (metric tons per capita)
  • Global Food Security Index
    Food Loss and Waste (1,000 tons/year)
    FLW per capita (kgs/person/year)
2012 248,452.41 917.87 3,694.35 2.13 50.3 37,336.16 150.27
2013 251,806.40 912.52 3,623.91 1.65 50.3 37,000.57 146.94
2014 255,129.00 890.81 3,491.62 1.45 49.20 59,326.88 232.54
2015 258,383.26 860.85 3,331.70 1.98 50.70 61,234.20 236.99
2016 261,554.23 931.88 3,562.85 2.15 53.60 63,292.26 241.99
2017 264,645.89 1,015.62 3,837.65 1.95 53.20 64,424.43 243.44
2018 267,663.44 1,042.24 3,893.85 2.13 54.80 68,826.08 257.14
2019 270,625.57 1,119.19 4,135.57 2.25 61.70 74,127.52 273.91
2020 271,857.97 1,058.69 3,895.62 2.07 61.60 76,005.70 279.58
08
Japan
  • Population (thousand people)
    GDP (billion current US$)
    GDP per capita (current US$)
    CO2 emissions (metric tons per capita)
  • Global Food Security Index
    Food Loss and Waste (1,000 tons/year)
    FLW per capita (kgs/person/year)
2012 127,629.00 6,203.21 48,603.48 9.63 79.6 21,661.65 169.72
2013 127,445.00 5,155.72 40,454.45 9.77 77.7 21,226.45 166.55
2014 127,276.00 4,850.41 38,109.41 9.48 78.5 21,410.45 168.22
2015 127,141.00 4,389.48 34,524.47 9.15 78.3 21,029.63 165.40
2016 126,994.51 4,922.54 38,761.82 8.94 79.5 20,737.83 163.30
2017 126,785.80 4,866.86 38,386.51 9.06 79.80 20,755.45 163.70
2018 126,529.10 4,954.81 39,159.42 8.76 79.90 20,523.31 162.20
2019 126,264.93 5,081.77 40,246.88 8.48 79.00 20,708.72 164.01
2020 125,244.76 5,040.11 39,986.93 8.03 80.10 20,125.83 160.69
09
Republic of Korea
  • Population (thousand people)
    GDP (billion current US$)
    GDP per capita (current US$)
    CO2 emissions (metric tons per capita)
  • Global Food Security Index
    Food Loss and Waste (1,000 tons/year)
    FLW per capita (kgs/person/year)
2012 50,199.85 1,278.43 25,466.76 11.63 74.6 11,184.91 222.81
2013 50,428.89 1,370.80 27,182.73 11.75 74.6 11,384.74 225.76
2014 50,746.66 1,484.32 29,249.58 11.57 74.00 12,015.18 236.77
2015 51,014.95 1,465.77 28,732.23 11.71 75.40 11,686.88 229.09
2016 51,217.80 1,500.11 29,288.87 12.11 75.80 11,559.13 225.69
2017 51,361.91 1,623.90 31,616.84 12.19 74.90 11,762.17 229.01
2018 51,606.63 1,720.58 33,340.27 12.22 75.60 11,658.99 225.92
2019 51,709.10 1,642.38 31,761.98 11.83 72.50 11,451.45 221.46
2020 51,844.69 1,644.31 31,721.30 10.99 70.10 11,114.66 214.38
10
Malaysia
  • Population (thousand people)
    GDP (billion current US$)
    GDP per capita (current US$)
    CO2 emissions (metric tons per capita)
  • Global Food Security Index
    Food Loss and Waste (1,000 tons/year)
    FLW per capita (kgs/person/year)
2012 29,068.16 314.44 10,817.44 7.52 67.20 3,475.07 119.55
2013 29,468.87 323.28 10,970.12 8.03 67.00 3,521.16 119.49
2014 29,866.56 338.06 11,319.08 8.13 69.10 15,125.65 506.44
2015 30,270.96 301.35 9,955.24 7.76 69.60 15,907.67 525.51
2016 30,684.80 301.26 9,817.74 8.09 69.80 14,106.93 459.74
2017 31,105.03 318.96 10,254.23 7.04 67.50 16,279.39 523.37
2018 31,528.59 358.58 11,373.23 7.45 68.10 15,673.18 497.11
2019 31,949.78 364.70 11,414.84 7.46 75.40 15,925.36 498.45
2020 33,199.99 337.01 10,160.83 7.38 67.90 15,530.92 467.80
11
Mexico
  • Population (thousand people)
    GDP (billion current US$)
    GDP per capita (current US$)
    CO2 emissions (metric tons per capita)
  • Global Food Security Index
    Food Loss and Waste (1,000 tons/year)
    FLW per capita (kgs/person/year)
2012 117,274.16 1,201.09 10,241.73 4.23 67.50 22,366.09 190.72
2013 118,827.16 1,274.44 10,725.18 4.13 66.60 22,920.64 192.89
2014 120,355.13 1,314.56 10,922.38 4.00 66.40 23,563.12 195.78
2015 121,858.26 1,170.56 9,605.95 3.96 68.00 24,302.64 199.43
2016 123,333.38 1,077.90 8,739.76 3.94 66.10 25,628.75 207.80
2017 124,777.32 1,157.74 9,278.42 3.86 66.40 26,325.66 210.98
2018 126,190.79 1,220.70 9,673.44 3.59 66.40 26,843.66 212.72
2019 127,575.53 1,258.29 9,863.07 3.61 71.40 26,897.96 210.84
2020 125,998.30 1,090.51 8,655.00 3.04 70.40 27,252.77 216.29
12
New Zealand
  • Population (thousand people)
    GDP (billion current US$)
    GDP per capita (current US$)
    CO2 emissions (metric tons per capita)
  • Global Food Security Index
    Food Loss and Waste (1,000 tons/year)
    FLW per capita (kgs/person/year)
2012 4,408.10 176.25 39,982.75 7.74 81.1 2,564.73 581.82
2013 4,442.10 190.85 42,962.99 7.53 80.9 2,630.38 592.15
2014 4,509.70 200.92 44,553.28 7.68 80.60 2,673.79 592.90
2015 4,595.70 177.47 38,616.00 7.59 81.70 2,717.43 591.30
2016 4,693.20 188.22 40,105.61 7.33 81.80 2,717.77 579.09
2017 4,793.90 205.42 42,849.43 6.84 81.20 2,659.25 554.72
2018 4,841.00 207.92 42,949.93 6.61 81.30 2,806.47 579.73
2019 4,917.00 206.93 42,084.35 6.83 78.30 2,803.71 570.21
2020 5,061.13 212.21 41,760.59 6.16 77.90 2,809.33 555.08
13
Papua New Guinea
  • Population (thousand people)
    GDP (billion current US$)
    GDP per capita (current US$)
    CO2 emissions (metric tons per capita)
  • Global Food Security Index
    Food Loss and Waste (1,000 tons/year)
    FLW per capita (kgs/person/year)
2012 7,631.00 21.30 2,790.68 0.67
2013 7,788.38 21.26 2,729.89 0.68
2014 7,946.73 23.21 2,920.78 0.74
2015 8,107.78 21.72 2,679.35 0.92
2016 8,271.76 20.76 2,509.63 0.91
2017 8,438.03 22.74 2,695.25 0.71
2018 8606.316 23.41249506 2,720.385245 0.76254978
2019 8,776.109 24.96961143 2,845.180186 0.78255289
2020 9,749.64 23.85 2,446.08 0.56
14
Peru
  • Population (thousand people)
    GDP (billion current US$)
    GDP per capita (current US$)
    CO2 emissions (metric tons per capita)
  • Global Food Security Index
    Food Loss and Waste (1,000 tons/year)
    FLW per capita (kgs/person/year)
2012 29,506.79 192.65 6,528.97 1.87 55.6 7,603.32 257.68
2013 29,773.99 201.18 6,756.75 1.57 55.7 8,007.99 268.96
2014 30,090.36 200.79 6,672.88 1.71 56.30 8,092.30 268.93
2015 30,470.73 189.81 6,229.10 1.73 57.80 8,411.16 276.04
2016 30,926.03 191.90 6,205.00 1.86 58.70 8,262.44 267.17
2017 31,444.30 211.01 6,710.51 1.72 59.50 8,409.75 267.45
2018 31,989.26 222.04 6,941.24 1.70 58.70 9,266.77 289.68
2019 32,510.45 226.85 6,977.70 1.74 63.90 9,511.63 292.57
2020 33,304.76 201.7026783 6063.62658 1.398566019 73 9459.43 284.03
15
Philippines
  • Population (thousand people)
    GDP (billion current US$)
    GDP per capita (current US$)
    CO2 emissions (metric tons per capita)
  • Global Food Security Index
    Food Loss and Waste (1,000 tons/year)
    FLW per capita (kgs/person/year)
2012 97,212.64 261.92 2,694.31 0.93 51.8 15,414.19 158.56
2013 98,871.55 283.90 2,871.43 0.99 48.9 15,324.58 154.99
2014 100,513.14 297.48 2,959.65 1.04 49.20 16,554.26 164.70
2015 102,113.21 306.45 3,001.04 1.15 50.90 16,870.21 165.21
2016 103,663.93 318.63 3,073.65 1.18 50.40 16,585.76 160.00
2017 105,173.26 328.48 3,123.23 1.25 49.00 17,018.31 161.81
2018 106,651.92 346.84 3,252.09 1.28 51.50 17,060.67 159.97
2019 108,116.62 376.80 3,485.08 1.32 61.60 17,471.94 161.60
2020 112,190.98 361.75 3,224.42 1.19 60.60 17,587.53 156.76
16
Russian
  • Population (thousand people)
    GDP (billion current US$)
    GDP per capita (current US$)
    CO2 emissions (metric tons per capita)
  • Global Food Security Index
    Food Loss and Waste (1,000 tons/year)
    FLW per capita (kgs/person/year)
2012 143,201.72 2,208.30 15,420.87 12.62 67.40 37,679.95 263.12
2013 143,507.00 2,292.47 15,974.64 12.12 66.40 38,421.79 267.73
2014 143,819.67 2,059.24 14,095.65 12.08 65.40 39,353.54 273.63
2015 144,096.87 1,363.48 9,313.01 11.79 66.00 40,507.19 281.11
2016 144,342.40 1,276.79 8,704.90 12.00 66.80 40,260.82 278.93
2017 144,496.74 1,574.20 10,720.33 11.04 66.20 40,256.73 278.60
2018 144,477.86 1,669.58 11,370.81 11.50 67.00 36,492.26 252.58
2019 144,373.54 1,699.88 11,585.00 11.80 69.10 36,893.21 255.54
2020 145,617.33 1,489.36 10,194.44 11.23 71.20 37,009.19 254.15
17
Singapore
  • Population (thousand people)
    GDP (billion current US$)
    GDP per capita (current US$)
    CO2 emissions (metric tons per capita)
  • Global Food Security Index
    Food Loss and Waste (1,000 tons/year)
    FLW per capita (kgs/person/year)
2012 5,312.44 295.09 55,546.49 9.41 83.20
2013 5,399.16 307.58 56,967.43 10.39 83.20
2014 5,469.72 314.85 57,562.53 10.36 84.30
2015 5,535.00 308.00 55,646.62 11.10 84.40
2016 5,607.28 318.65 56,828.30 6.69 85.40
2017 5,612.25 341.86 60,913.75 8.43 85.00
2018 5,638.68 373.22 66,188.78 8.02 85.90
2019 5,703.57 372.06 65,233.28 7.92 88.00
2020 5,909.87 345.29 61,274.01 7.69 74.70
18
Chinese Taipei
  • Population (thousand people)
    GDP (billion current US$)
    GDP per capita (current US$)
    CO2 emissions (metric tons per capita)
  • Global Food Security Index
    Food Loss and Waste (1,000 tons/year)
    FLW per capita (kgs/person/year)
2012 23,316.00 495.54 21,295 11.62 74.80 4,047.17 173.58
2013 23,374.00 512.96 21,973.00 11.64 74.40 4,091.14 175.03
2014 23,434.00 535.33 22,874.00 11.79 4,243.37 181.08
2015 23,492.00 534.47 22,780.00 11.74 4,143.24 176.37
2016 23,540.00 543.00 23,091.00 11.87 4,068.25 172.82
2017 23,571.00 590.78 25,080.00 12.08 4,220.91 179.07
2018 23,588.00 609.25 25,838.00 4176.67 177.07
2019 23,603.00 612.10 25,941.00 4117.64 174.45
2020 23,821.46 673.25 28,549.00 4,052.74 170.13
19
Thailand
  • Population (thousand people)
    GDP (billion current US$)
    GDP per capita (current US$)
    CO2 emissions (metric tons per capita)
  • Global Food Security Index
    Food Loss and Waste (1,000 tons/year)
    FLW per capita (kgs/person/year)
2012 67,835.96 397.56 5,860.58 4.03 57.7 16,883.71 248.89
2013 68,144.50 420.33 6,168.26 4.21 58.5 16,779.01 246.23
2014 68,438.73 407.34 5,951.88 4.11 58.6 19,145.90 279.75
2015 68,714.51 401.30 5,840.05 4.14 58.5 18,865.96 274.56
2016 68,971.33 413.43 5,994.23 4.11 59.00 18,725.17 271.49
2017 69,209.86 456.29 6,592.91 3.77 58.30 19,797.62 286.05
2018 69,428.52 506.51 7,295.48 3.72 58.90 19,226.35 276.92
2019 69,625.58 543.65 7,808.19 3.85 64.80 18,935.81 271.97
2020 71,475.66 500.23 7,001.79 3.71 61.40 18,862.84 263.91
20
United States
  • Population (thousand people)
    GDP (billion current US$)
    GDP per capita (current US$)
    CO2 emissions (metric tons per capita)
  • Global Food Security Index
    Food Loss and Waste (1,000 tons/year)
    FLW per capita (kgs/person/year)
2012 313,830.99 16,197.01 51,610.61 16.19 85.6 103,866.15 330.96
2013 315,993.72 16,784.85 53,117.67 16.36 85.2 104,441.14 330.52
2014 318,301.01 17,521.75 55,047.73 16.42 85.5 105,650.23 331.92
2015 320,635.16 18,219.30 56,822.52 15.99 84.6 105,085.61 327.74
2016 322,941.31 18,707.19 57,927.52 15.50 85.5 108,672.45 336.51
2017 324,985.54 19,485.39 59,957.73 14.82 84.9 107,422.97 330.55
2018 326,687.50 20,529.05 62,840.02 15.22 85.00 105,524.30 323.01
2019 328,239.52 21,374.42 65,118.36 14.67 85.00 104,312.02 317.79
2020 335,942.00 21,060.47 63,528.63 13.03 79.10 108,990.67 324.43
21
Viet Nam
  • Population (thousand people)
    GDP (billion current US$)
    GDP per capita (current US$)
    CO2 emissions (metric tons per capita)
  • Global Food Security Index
    Food Loss and Waste (1,000 tons/year)
    FLW per capita (kgs/person/year)
2012 89,802.49 155.82 1,735.14 1.59 52.7 17,020.92 189.54
2013 90,753.47 171.22 1,886.67 1.62 53.4 17,414.67 191.89
2014 91,714.60 186.20 2,030.26 1.82 54.50 20,023.68 218.33
2015 92,677.08 193.24 2,085.10 2.03 54.30 20,488.61 221.08
2016 93,638.72 205.28 2,192.21 2.06 56.90 20,732.44 221.41
2017 94,596.64 223.78 2,365.62 2.44 55.30 21,177.35 223.87
2018 95,540.40 245.21 2,566.60 3.01 56.00 21,538.97 225.44
2019 96,462.11 261.92 2,715.28 3.57 64.10 21,817.21 226.17
2020 96,648.69 271.16 3,586.35 3.68 65.50 22,204.82 229.75
FILL IN THE FORM TO DOWNLOAD