Methodology
Flow Chart
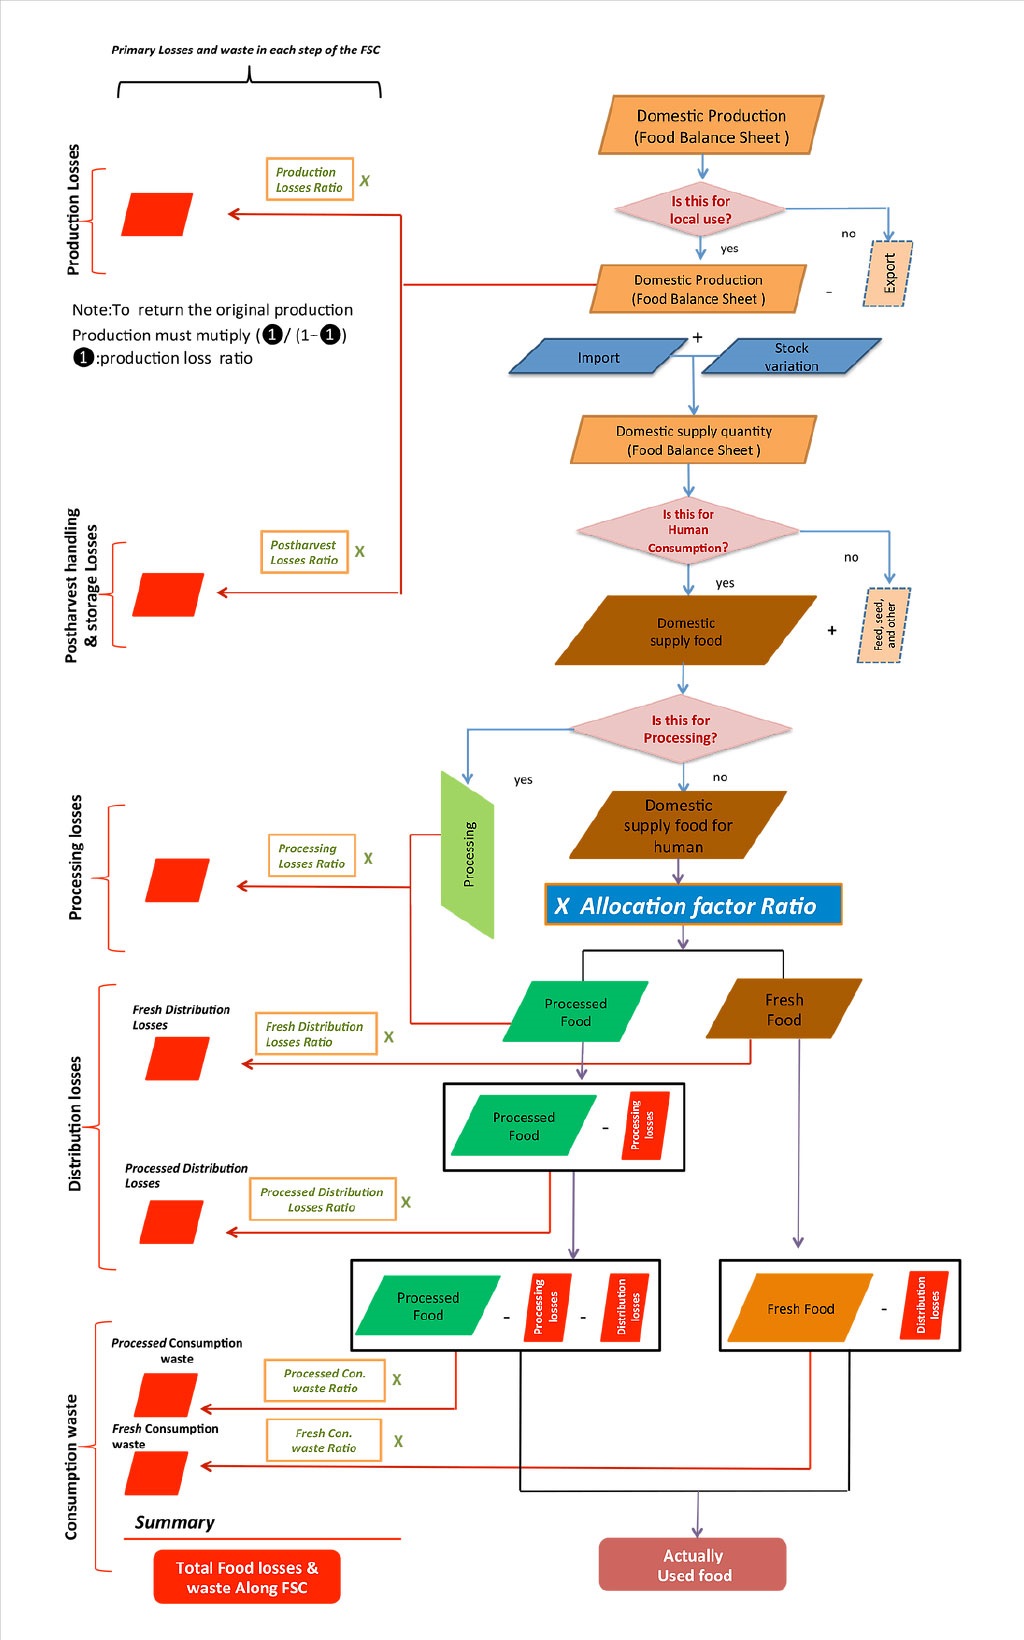
For each member economy, we calculate the losses in each stage of the food supply chain using the regional loss percentage defined by Gustavsson et al. (2011) and FAO's Food Balance Sheet of 2011. A schematic flowchart of the calculation is given as follows:


Example: Calculations on losses and waste of Vegetables in UNITED STATES. The figure below shows the mass flow of total Vegetables (1000 tons), as presented in the 2011 Food Balance Sheet for UNITED STATES.
First through the Allocation factor we determines the part of the agricultural produce that is allocated for human Consumption or Fresh use
Fresh food: 8157*0.4 = 12236
Processed food 8157*(1-0.4)= 18354
Calculations on primary equivalent F&V losses and waste in each step of the FSC:
Agricultural production: (0.2/(1-0.2))* 27074 =6768.5 thousand tonnes
Postharvest handling and storage: 0.04* 27074 = 1082.96 thousand tonnes
Processing and packaging = 0.02*(18354+3967) =446.42 thousand tonnes
Distribution (fresh food): 0.12*12236 = 1468.32 = 1468.32 thousand tonnes
Distribution (processed food): 0.06*(18354+3967-446.42) =1312.47 thousand tonnes


